Advanced Logging
There are a number of ways to log something in Wallaby and quickly inspect the output inline, in hovers, or inside the
Wallaby Overview Logs or Side Panel Logs views:
- Logpoints - use editor breakpoints to display the value of any expression
- Value Peek - display values by hovering over them
- Live Value Display - display values with a special command
-
Using print - log with
print - Identifier expressions - log by simply typing a variable name
- Live Comments - use special comments to display values
- Live Value Display - display values with a special command
-
Using print - log with
print - Identifier expressions - log by simply typing a variable name
- Live Comments - use special comments to display values
Logpoints
Logpoints allow VS Code breakpoints to be used to display the value of any expression. Using breakpoints to manage displaying values offers a number of advantages:
- No modification to source code is necessary
- They are easily added and removed using familiar keyboard shortcuts (F9, or ⇧F9 for inline breakpoints)
- They offer a clear visual indicator of what is being logged (especially when placed within lines as
inline breakpoints) - No debugger required (Wallaby uses the breakpoint information directly to determine what to log)
- They are managed by your editor, and will persist when files are closed and reopened
- They can be added to classes and functions to log all lines within them
Value Peek
Value Peek provides another way to quickly inspect values without modifying your code. When enabled, hovering over any
expression or selection will evaluate, capture, and display the associated value(s). To avoid clutter, in-editor display
and inclusion of values in Wallaby’s Logs section are suppressed by default, but can be shown by using the
Explore Value icon (to the right of the value in the hover).
Value Peek is similar to Watch Expressions, but is available when the debugger is not running, and can display values from all test execution paths simultaneously.
Live Value Display
Sometimes you may also want to quickly display some expression value, but without modifying your code. Live Value
Display allows you to do it with a special command (Show Value command/intention action, or with a corresponding
keyboard shortcut).
Note that the expression being logged either needs to be selected, or the cursor position needs to be right after the expression being logged when the command is invoked.
Note: you may use the Live Comments feature to log any expression value when you want to keep displaying the value when you change your code or restart Wallaby.
Using print
For those new to Wallaby, a familiar method to log values is to simply use print(anything). Wallaby supports
logging values with the same print function that you are used to.
Identifier expressions
Another simple way to log something is to just type a variable name and get its value(s) displayed:
Note that only simple identifier expressions, for example a, are automatically logged this way, but not other types of
expressions, for example not a.b or a.b(). To log other types of expressions, you may use one of the other logging
methods described in this article.
Live Comments
Values
Live Comments allow special comments to be used to display values. Inserting the special comment #? after a
statement will log just the value of that expression.
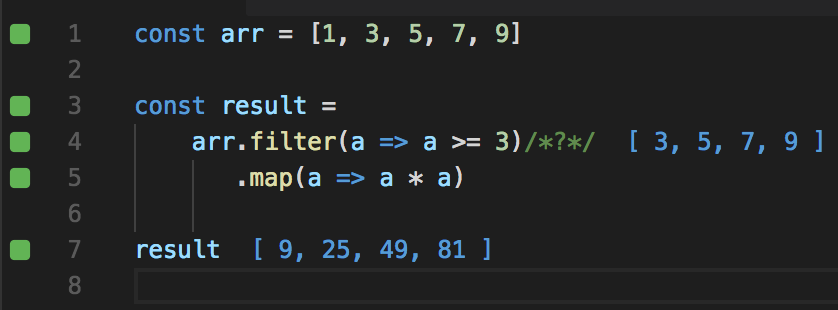
For example, to log the result of a function call:
result = calculate_total(items) #?To log the value of a variable assignment:
filtered = [x for x in data if x > 0] #?Live comment snippet
To save some time typing the comment when you need it, you may:
- create a code snippet in VS Code with a custom keybinding.
Performance Testing
The feature also allows you to quickly see how various parts of your code perform. It can be very helpful for identifying possible bottlenecks in your app and for doing the performance optimization.
Inserting the special comment #?. after any statement will report how much time it took to execute the
statement.
Adding the comment to an expression that gets executed multiple times, for example inside a loop, will make the tool to display total execution time, average execution time (total execution time divided by number of times the expression had been executed), minimum and maximum execution time.
Auto-Expanding Logged Values
By default, Wallaby limits how much of an object is logged and displayed in the Overview Logs and Side Panel Logs to
prevent performance issues.
You may expand objects in the Overview Logs and Side Panel Logs views by clicking on the object in the log. When you
do this, Wallaby will retrieve additional properties and display them in the log.
Identifier expressions and
Live Comments can be provided with an additional hint to automatically
log objects with additional properties. Inserting the special comment #?+ after any expression will expand your
object and its properties within the Overview Logs and Side Panel Logs views.
Note that automatically expanded objects have the following limitations:
- Cyclic Dependencies are not automatically expanded
- Functions are not automatically expanded
- Strings beyond 8192 characters are not automatically expanded
- Only the first 100 properties on a single object will be expanded
- Only the first 100 elements of an array will be expanded
- Only the first 10 levels of nested properties will be expanded
- Only the first 5000 properties across all objects will be expanded
Automatically expanded objects also resolve property getters, so in case of
class A:
    @property
    def b(self):
        return 1

a = A()
a  #?+
the output will be { b: 1 }.
Show Value / Copy Value / Show Timing(s)
Wallaby provides two commands that allow you to quickly get the value of an expression without changing your code:
Show Valuedisplays the value of your expression in your code editor right beside the expression, and will allow you to explore the value in theOverview LogsandSide Panel Logsviews.Copy Valuedisplays the value of your expression in your code editor right beside the expression AND expands the value and copies the value to the clipboard. LikeCopy Value, you may explore the value using theOverview LogsandSide Panel Logsviews.-
Show Line Value(s)will output the same asShow Valuefor the selected line(s) as if you had selected the entire line to display. -
Show Line Timing(s)will output Execution time for the selected line(s) as if you had used the#?.comment for the line.
Show Valuedisplays the value of your expression in your code editor right beside the expression, and will allow you to explore the value in theOverview LogsandSide Panel Logsviews.Copy Valuedisplays the value of your expression in your code editor right beside the expression AND expands the value and copies the value to the clipboard. LikeCopy Value, you may explore the value using theOverview LogsandSide Panel Logsviews.
Please note: Copy Value expansion has the same limitations as
Auto-Expanding Logged Values.