Why Wallaby
Wallaby is a continuous testing tool for Python, built by the team behind Wallaby.js — a tool that has helped thousands of JavaScript and TypeScript developers test more productively since 2015. Wallaby.py brings the same instant feedback experience to Python, running your tests as you code and providing real-time results, code coverage, and errors directly in your editor.
If you also work with JavaScript or TypeScript, Wallaby.js provides the same experience for those projects.
Compared to basic editor testing extensions or CLI workflows, Wallaby delivers a radically different experience focused on speed, simplicity, and seamless integration into your development workflow. Here’s why Wallaby stands out and how it can transform the way you test.
Wallaby fits naturally into any development workflow, whether you write tests after your code, alongside it, or follow methodologies like Test-Driven Development (TDD) or Behavior-Driven Development (BDD).
Wallaby supports pytest and unittest, and works with Python 3.8 through 3.14.
Instant, In-Editor Feedback
Basic editor extensions or CLI workflows often show hard-to-navigate errors, plain text logs without syntax highlighting, distracting coverage overlays or separate coverage reports, and flickering, spinner-laden test lists.
Wallaby runs your tests as you type and brings all this information together in context, right inside your editor. Test results, errors, logs, and coverage appear directly beside the relevant lines of code, and are organized in a dedicated view for easy navigation. Many screenshots in our docs show JavaScript or TypeScript projects, but the features and workflow apply equally to Python projects.
- Logs are shown in an expandable tree view for easy exploration of deeply nested data, and support infinite canvas diagrams for visualizing complex structures.
- Error reports are interactive, with navigable stacks, code previews, and specialized handling for different error types.
- Realtime gutter indicators show which lines are fully, partially, or not covered. You can view individual test coverage, toggle uncovered regions, or open a strategic, aggregated view of your project’s coverage.
Smart Test Execution
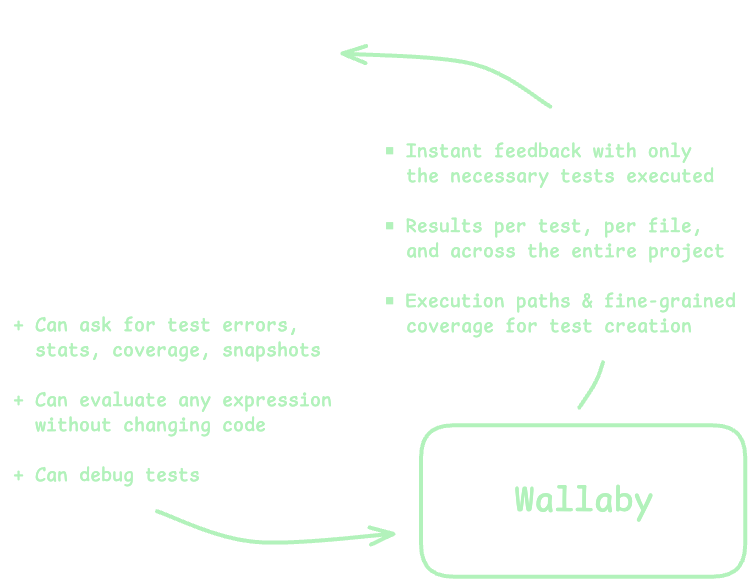
Other test runners, even in watch mode, rely on basic dependency tracking that re-runs all tests in any test file affected by a code change, even if most of those tests are unrelated. Wallaby instead tracks changes at a much finer level and runs only the tests actually affected, often just a single test, giving you dramatically faster feedback.
At the same time, Wallaby ensures you always have up-to-date results for the entire project. Unlike workflows where you run one test manually and lose visibility into the rest, Wallaby continuously keeps the full test suite status accurate, so you immediately know if a change breaks something elsewhere.
It also includes powerful features designed to keep large projects fast and responsive, no matter their size:
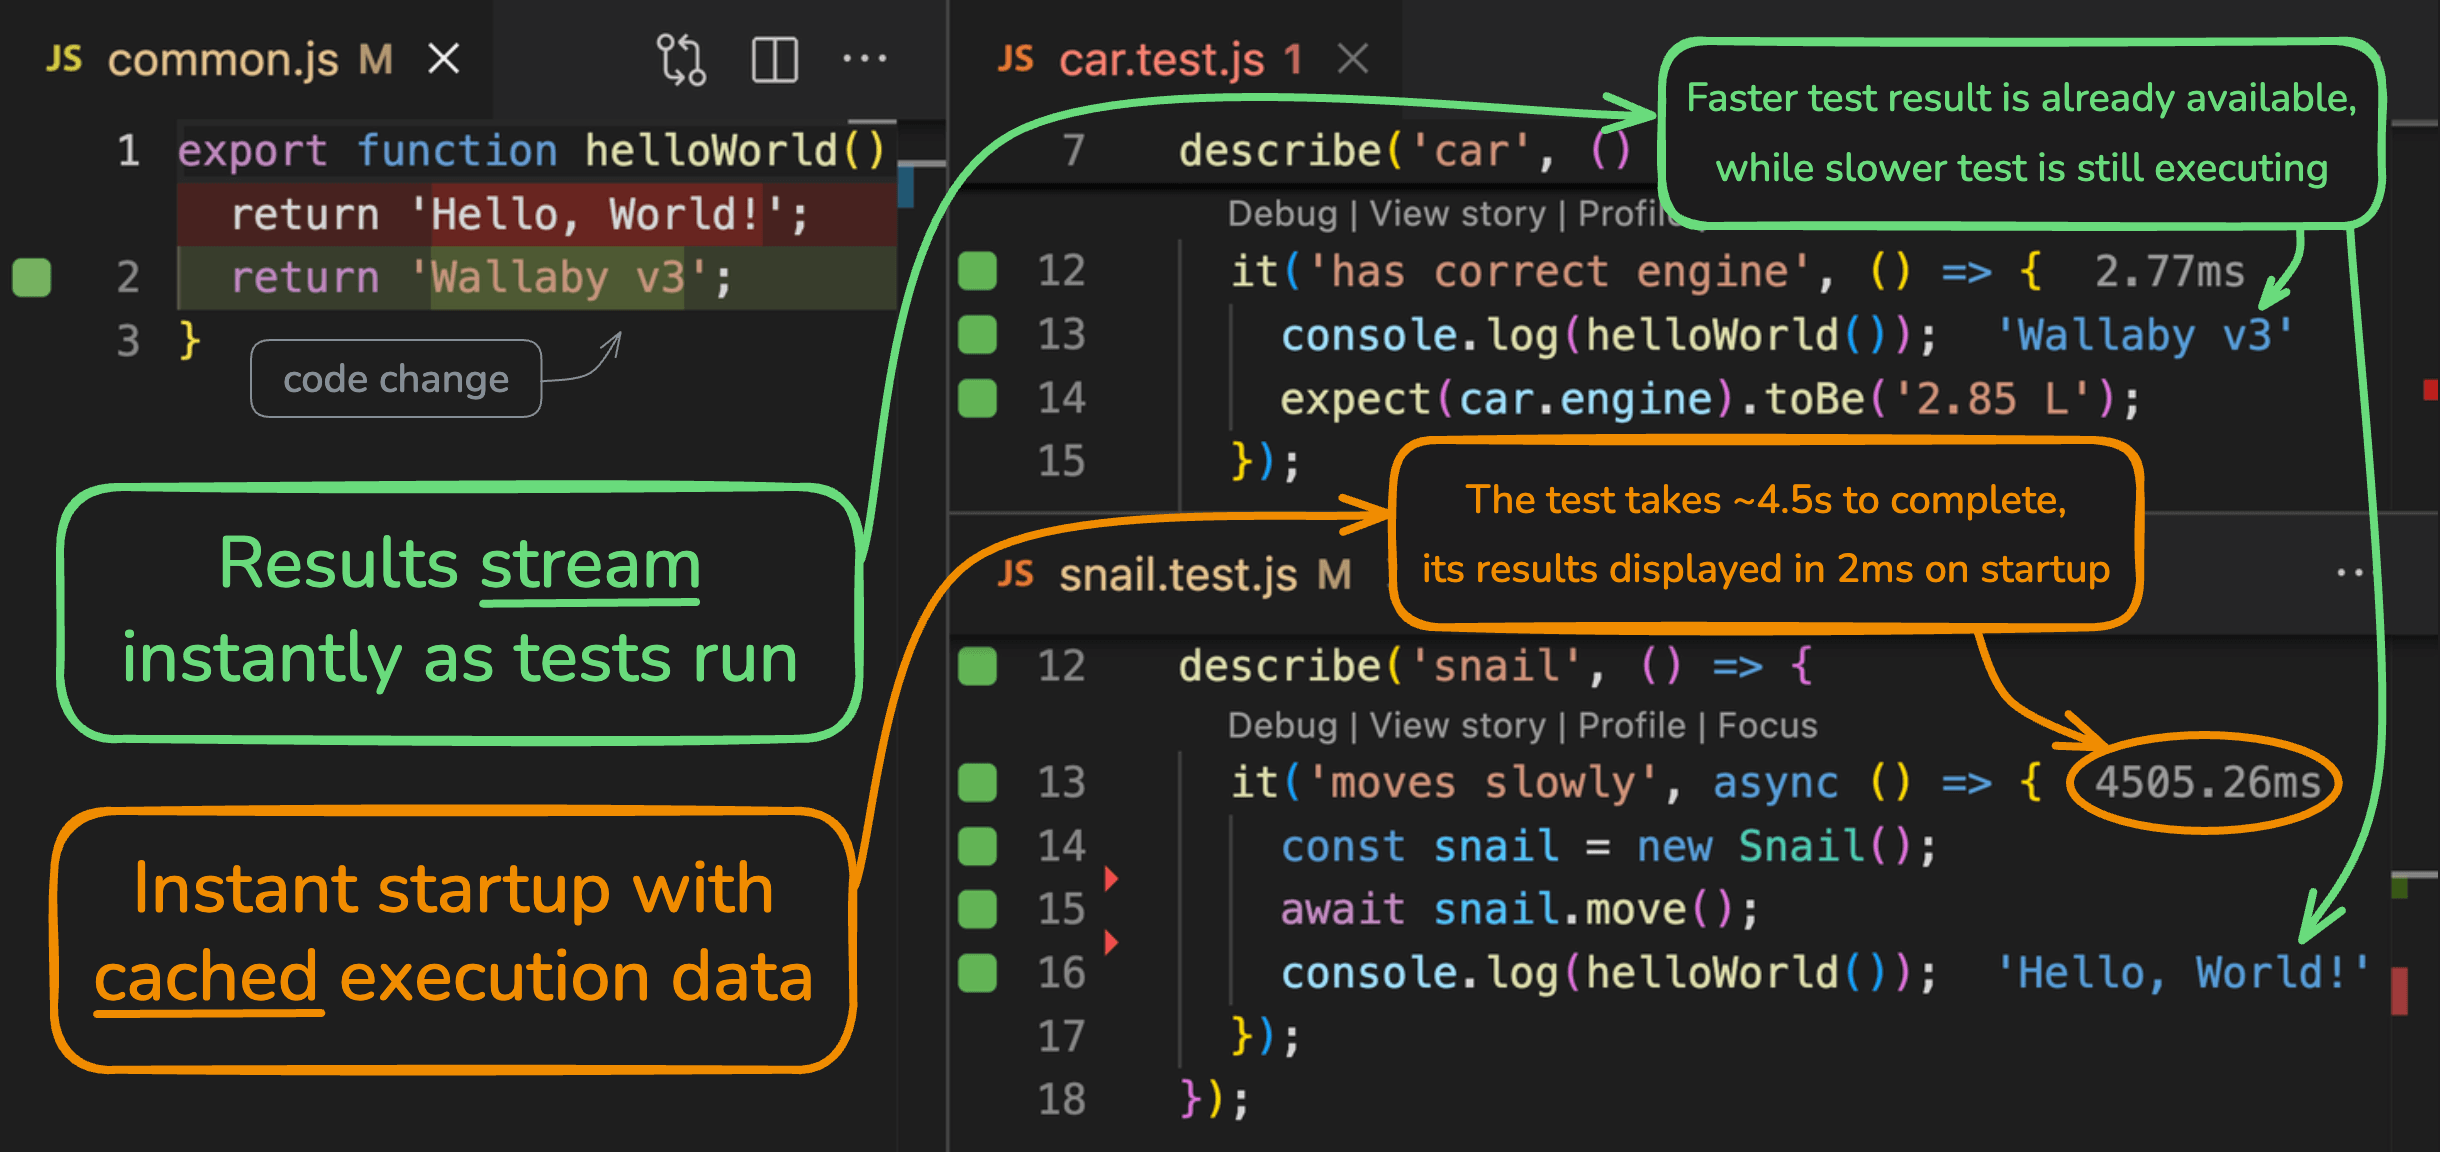
- Real‑time result streaming: tests, coverage, logs, and errors stream live into your editor, so you spot issues immediately without waiting for a full run to finish.
- Instant startup with cached results: cached execution data lets you start instantly and get immediate feedback, even on large projects.
- Smart Start: Wallaby has an option to only start tests for the files that you’re currently working on (either by opening them or editing them), instead of all tests in your project. This ensures that you get feedback on your changes quickly.
Powerful Debugging Tools
Wallaby isn’t just about running tests, it’s about helping you understand your code better. While other test runners may provide basic error stacks and a link to launch a classic debugger, Wallaby offers a suite of advanced debugging tools that give you deep insights into your code’s behavior:
- You can inspect variables and runtime values inline, right next to the code, and even use Wallaby’s special comment format to measure code execution times or log values without adding print statements. Powerful log viewer helps you to filter, search, and analyze logs effectively, interactive diagrams help you visualize complex data structures.
- The time travel debugging feature allows you to step backward and forward in your code execution to see exactly how a bug occurred. The interactive timeline provides a visual representation of your code’s execution steps.
- The test focusing feature lets you isolate and explore coverage, logs and errors for a specific test or groups of tests, making it easier to debug complex scenarios.
- The test story feature provides a unique and highly efficient way of debugging your code and inspecting what code your test is executing in a single logical view.
AI Integration
Wallaby AI tools and MCP server support Copilot Agent, Cursor, Claude Code, Windsurf, Cline, RooCode, and many other AI agents, enabling them to access Wallaby’s rich runtime insights on demand.
Without Wallaby, AI agents see only basic test runner output or IDE problem lists, limiting their understanding of code behavior and execution. With Wallaby, they access a live, detailed model of your codebase and test environment, including:
- Real-time runtime values without modifying code
- Complete execution paths for specific tests or entire projects
- Branch-level code coverage analytics
- Detailed code dependency graphs
- Test snapshot management capabilities
Flexible Across Editors and Frameworks
Wallaby supports pytest and unittest testing frameworks, and works with Python versions 3.8 through 3.14.
No matter which testing framework you’re using, the Wallaby interface remains consistent, so once you learn Wallaby, you can switch between projects and frameworks without having to adjust to different ways of interpreting test results.
Next Steps
To get started with Wallaby, install the extension, then follow our Quick Start guide.
Show your support
Let the world know your project is using Wallaby for testing by adding this badge:
![]()
[](https://wallabyjs.com)